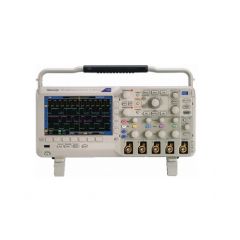
DPO2014 Tektronix Digital Oscilloscope
Features:
Bandwitdh: 100 MHz
4 Channels
1 GS/s Sample Rate on All Channels
1 Megapoint Record Length on All Channels
5,000 wfm/s Maximum Waveform Capture Rate
Suite of advanced triggers
Ease of Use Features
Wave Inspector® Controls Provide Easy Navigation and Automated Search of Waveform Data
FilterVu™ Variable Low-pass Filter Allows for Removal of Unwanted Signal Noise while still Capturing High-frequency Events
29 Automated Measurements, and FFT Analysis for Simplified Waveform Analysis
TekVPI® Probe Interface Supports Active, Differential, and Current Probes for Automatic Scaling and Units
7 in. (180 mm) Widescreen TFT-LCD Color Display
USB 2.0 Host Port on the Front Panel for Quick and Easy Data Storage
USB 2.0 Device Port on Rear Panel for Easy Connection to a PC or Direct Printing to a PictBridge®-compatible Printer
Plug 'n' Play PC connectivity and analysis software solutions
TekVPI Probe Interface supports active, differential, and current probes for automatic scaling and units
The Tektronix DPO2014 digital phosphor oscilloscope (DPOs) delivers the performance and tools you need to visualize your signals and find answers quickly. The DPO2000 Series are the first oscilloscopes to provide 1 M points of usable record length on all channels, serial trigger and decode analysis options, a variable low-pass filter that also allows you to see signal details to the oscilloscope’s full bandwidth and all in a compact form factor.
Wave Inspector Navigation and Search
Record length, one of the key specifications of an oscilloscope, is the number of samples it can digitize and store in a single acquisition. The longer the record length, the longer the time window you can capture with high timing resolution (high sample rate).
The first digital oscilloscopes could capture and store only 500 points, which made it very difficult to acquire all relevant information around the event being investigated. Over the years, oscilloscope vendors have provided longer and longer record lengths to meet market demands for long capture windows with high resolution. These mega-point record lengths often represent thousands of screens worth of signal activity. While standard record lengths have increased greatly over the years and can now satisfy the vast majority of applications in the marketplace, tools for effectively and efficiently viewing, navigating, and analyzing long record length acquisitions have been sorely neglected until now.
The Tektronix MSO/DPO2000 Series redefines expectations for working with long record lengths with the following innovative Wave Inspector controls:
Zoom/Pan
A dedicated, two-tier front-panel control provides intuitive control of both zooming and panning. The inner control adjusts the zoom factor (or zoom scale); turning it clockwise activates zoom and goes to progressively higher zoom factors, while turning it counterclockwise results in lower zoom factors and eventually turning zoom off. The outer control pans the zoom box across the waveform to quickly get to the portion of the waveform you are interested in.
The outer control also utilizes force-feedback to determine how fast to pan on the waveform. The farther you turn the outer control, the faster the zoom box moves. Pan direction is changed by simply turning the control the other way. No longer do you need to navigate through multiple menus to adjust your zoom view.
Play/Pause
A dedicated play/pause button on the front panel scrolls the waveform across the display automatically while you look for anomalies or an event of interest. Playback speed and direction are controlled using the intuitive pan control.
Once again, turning the control further makes the waveform scroll faster and changing direction is as simple as turning the control the other way.
User Marks
See something interesting on your waveform? Press the Set Mark button on the front panel to leave one or more “bookmarks” on the waveform. Navigating between marks is as simple as pressing the Previous (←) and Next (→) buttons on the front panel
Search Marks
Serial Triggering and Analysis
Bus Display
Provides a higher level, combined view of the individual signals (clock, data, chip enable, etc.) that make up your bus, making it easy to identify where packets begin and end and identifying sub-packet components such as address, data, identifier, CRC, etc.
Serial Triggering
Bus Decoding
Tired of having to visually inspect the waveform to count clocks and determine if each bit is a 1 or a 0, and then combine bits into bytes and determine the hex value? Let the oscilloscope do it for you! Once you’ve set up a bus, the oscilloscope will decode each packet on the bus and display the value in either hex, binary, decimal (LIN only), or ASCII (RS-232/422/485/UART only) in the bus waveform.
Event Table
In addition to seeing decoded packet data on the bus waveform itself, you can view all captured packets in a tabular view much like you would see on a logic analyzer. Packets are time-stamped and listed consecutively with columns for each component (Address, Data, etc.). The event table can also be exported for use offline.
Search
Serial triggering is very useful for isolating an event of interest, but once you’ve captured it and need to analyze the surrounding data, what do you do? In the past, you had to manually scroll through the waveform, counting and converting bits and looking for what caused the event. With the MSO2000 and DPO2000 Series, you can have the oscilloscope automatically search through the acquired data for user-defined criteria including serial packet content. Each occurrence is marked for easy reference.
Rapid navigation between marks is as simple as pressing the Previous (←) and Next (→) buttons on the front panel.
PC Connectivity and USB Data Storage
Simply pull screen images and waveform data into the stand-alone desktop application or directly in Microsoft Word and Excel. To complement OpenChoice, National Instruments LabVIEW SignalExpressTM Tektronix Edition software provides you with extended capabilities, including advanced analysis, remote oscilloscope control and live waveform analysis. Alternatively, if you prefer not to use the PC, you can simply print your image directly to any PictBridge® compatible printer using the USB device port.
TekVPI® Probing
The TekVPI probe interface sets the standard for ease of use in probing. TekVPI probes feature status indicators and controls, as well as a probe menu button right on the input compensation box itself. This button brings up a probe menu on the oscilloscope display with all relevant settings and controls for the probe. The TekVPI interface utilizes a new probe power management architecture enabling direct attachment of current probes (Requires TekVPI External Power Supply - Tektronix Part number: 119-7465-xx).
Finally, TekVPI probes can be controlled remotely by using USB, GPIB, or Ethernet, enabling more versatile solutions in ATE environments.
REQUEST A QUOTE