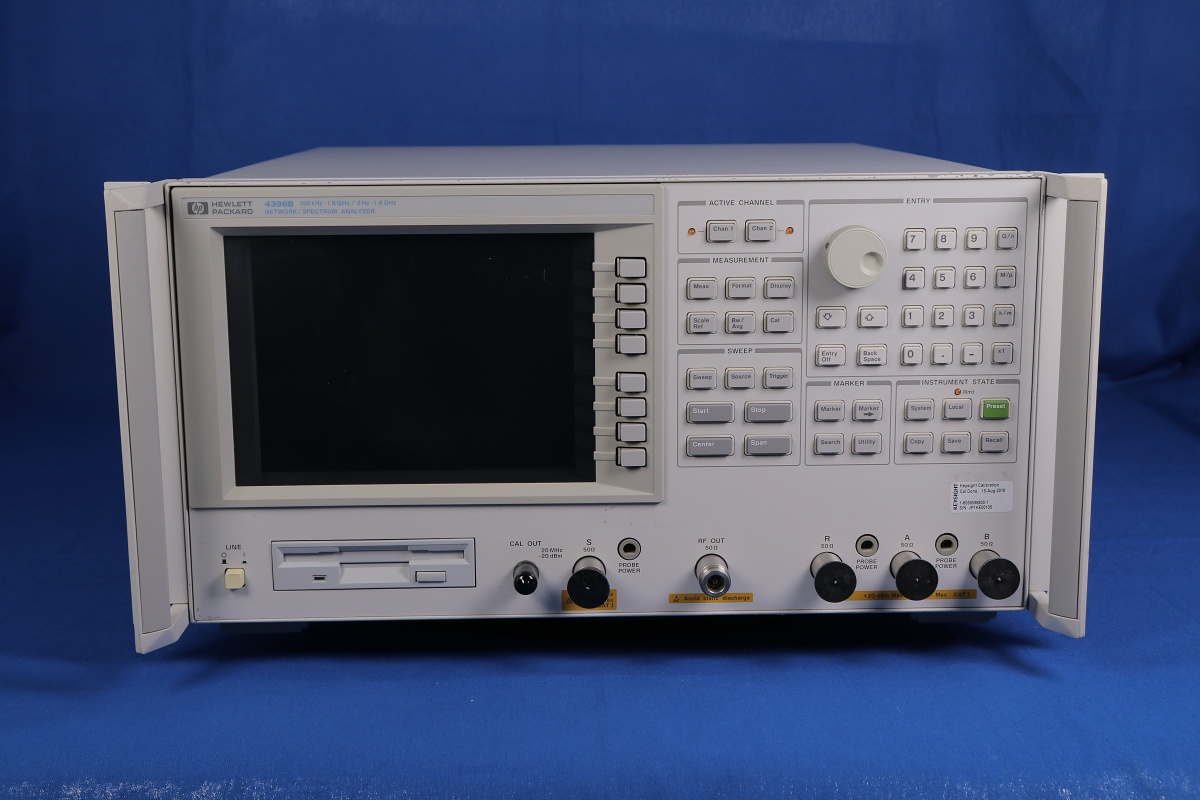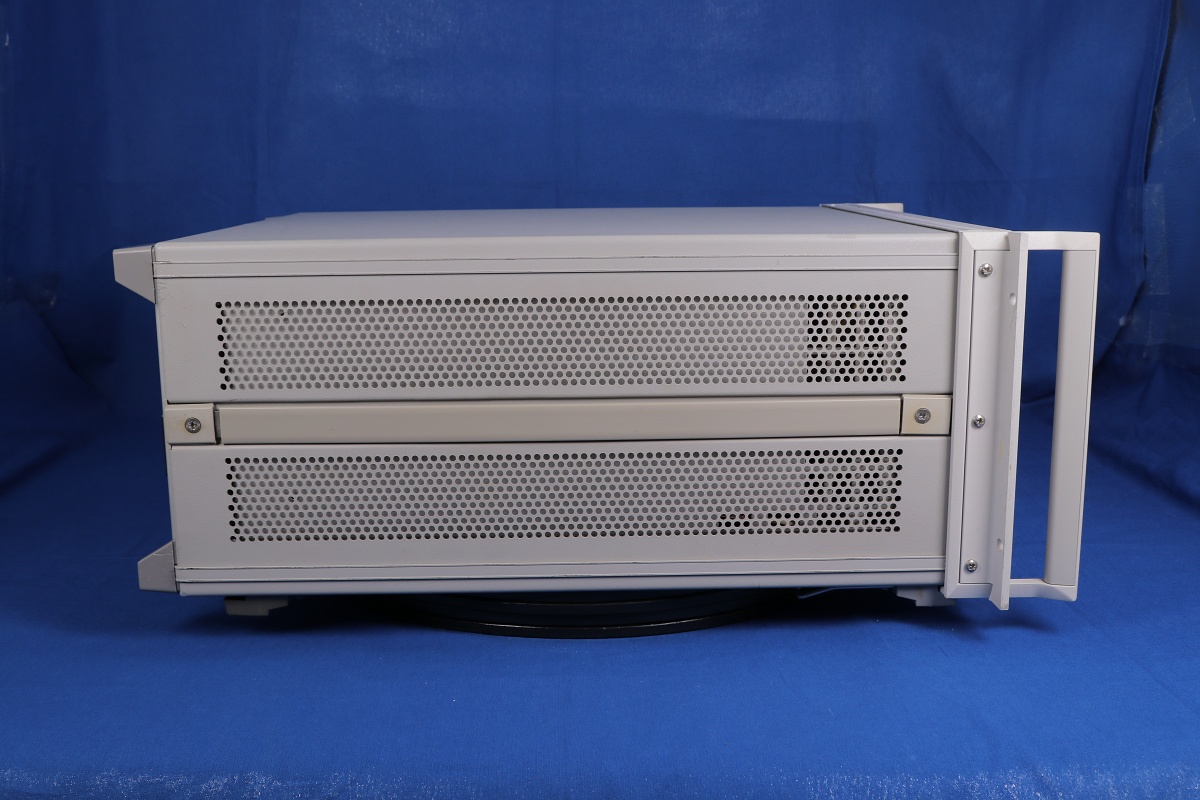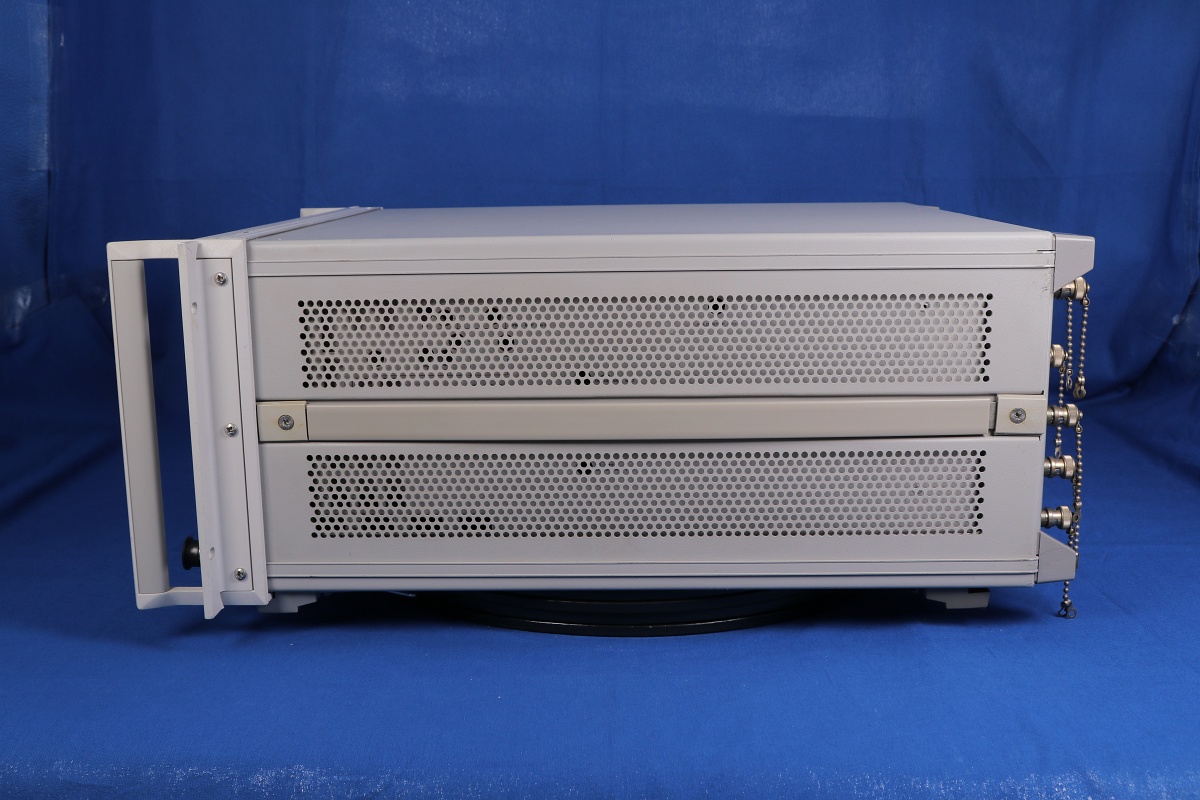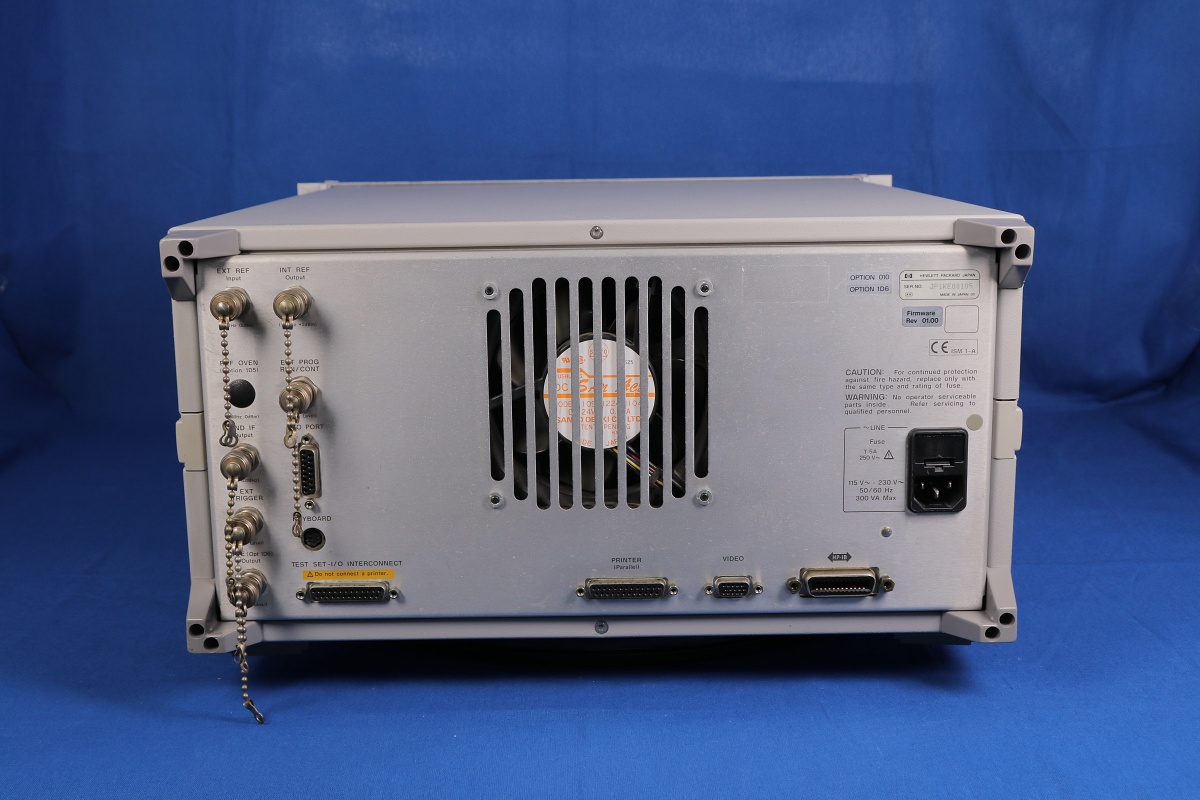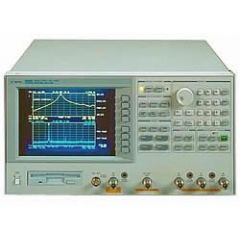
4396B HP Network Analyzer
2 Hz to 1.8 GHz, RBW 1 Hz to 3 MHz
Full vector network and spectrum measurement and analysis
Wide dynamic range network measurement with fast sweep speeds
±0.05 dB/0.3d°C dynamic magnitude/phase accuracy
REQUEST A QUOTE
4396B HP Network Analyzer
Detail
Additonal Features:
2 Hz to 1.8 GHz, RBW 1 Hz to 3 MHz
Full vector network and spectrum measurement and analysis
Wide dynamic range network measurement with fast sweep speeds
±0.05 dB/0.3d°C dynamic magnitude/phase accuracy
Extremely fast narrowband spectrum measurement
Impedance analysis option and test kit available
±1.0 dB level accuracy for spectrum analysis
-150 dBm/Hz sensitivity for spectrum analysis
Built-in IBASIC for easy test automation
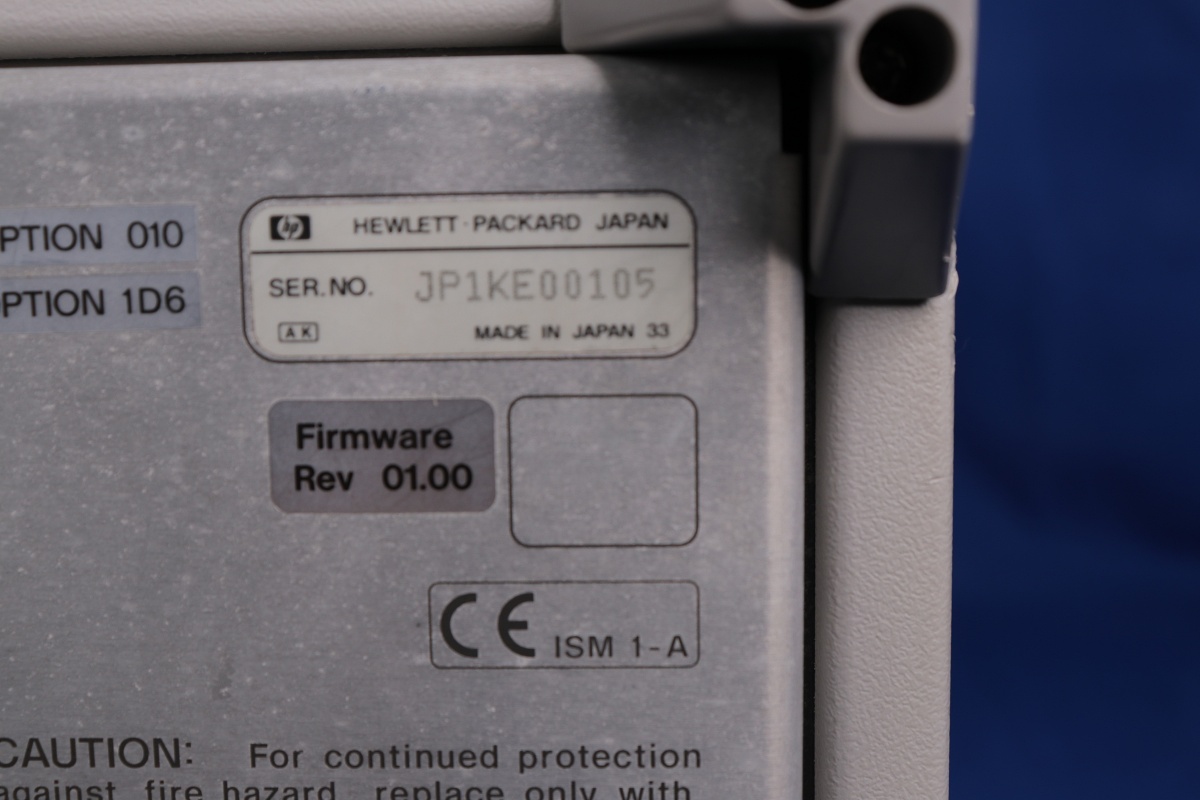
Time-gated spectrum analysis option
Color TFT display and built-in disk drive/RAM disk
The Agilent 4396B provides excellent RF vector network, spectrum, and optional impedance measurements for lab and production applications. Gain, phase, group delay, distortion, spurious, CN, and noise measurements often required for evaluating components and circuits can be measured using one instrument. Combined with a test set, the Agilent 4396B provides reflection measurements, such as return loss, and SWR, and S parameters. As a vector network analyzer, the Agilent 4396B operates from 100 kHz to 1.8 GHz with 1 mHz resolution and its integrated synthesized source provides -60 to +20 dBm of output power with 0.1 dB resolution. The dynamic magnitude and phase accuracy are ±0.05 dB and ±0.3° so that it can accurately measure gain and group delay flatness, which are becoming more important in modern electronics systems. A spectrum analyzer, the Agilent 4396B operates from 2 Hz to 1.8 GHz with resolution bandwidths (RBWs) spanning 1 Hz to 3 MHz in a 1-3-10 sequence. A fully-synthesized local oscillator allows stable and accurate frequency analysis. Direct A/D conversion (no LOG amplifier is used) results in ±1.0 dB overall level accuracy. Noise sidebands fall below -105 dBc/Hz offset 10 kHz from carriers below 1 GHz, while sensitivity is -50 dBm/Hz at 10 MHz and -147 dBm/Hz at 1 GHz. In addition, with two independent display channels available, you can simultaneously view network and spectrum (or transmission and reflection) characteristics of the device under test in split-screen format. For example, an amplifier's frequency response (network measurement) and distortion (spectrum measurement) can be shown at the same time.
Option
| Option |
Description |
| 001 |
DC bias source |
| 010 |
Impedance measurement function |
| 1D5 |
High Stability Frequency Reference |
| 1D6 |
Time-Gated Spectrum Analysis |
Download
Video

